<?xml version="1.0" encoding="utf-8"?><feed xmlns="http://www.w3.org/2005/Atom" ><generator uri="https://jekyllrb.com/" version="3.10.0">Jekyll</generator><link href="https://zgmacro.com/feed.xml" rel="self" type="application/atom+xml" /><link href="https://zgmacro.com/" rel="alternate" type="text/html" /><updated>2026-05-07T21:25:42+00:00</updated><id>https://zgmacro.com/feed.xml</id><title type="html">Economics Today</title><subtitle>Accessible research and commentary on global macroeconomic topics</subtitle><entry><title type="html">Long the Echo, Not the Shock: Wheat, Sugar and SONIA in an Oil Shock</title><link href="https://zgmacro.com/2026/05/01/Long-the-Echo.html" rel="alternate" type="text/html" title="Long the Echo, Not the Shock: Wheat, Sugar and SONIA in an Oil Shock" /><published>2026-05-01T00:00:00+00:00</published><updated>2026-05-01T00:00:00+00:00</updated><id>https://zgmacro.com/2026/05/01/Long%20the%20Echo</id><content type="html" xml:base="https://zgmacro.com/2026/05/01/Long-the-Echo.html"><![CDATA[<p>This post is an example of how to turn a geopolitical shock into a cross-asset framework: 
identify the obvious trade, look for lagged transmission channels, express the view with a defined downside, 
and hedge the scenario. 
The Iran war has been priced first as an oil shock, but the more interesting question is whether it becomes a commodity, food, and rate shock.</p>

<h3 id="background">Background</h3>

<p>Strait of Hormuz traffic has been severely disrupted by the war in Iran. 
As a result, 25% of the world’s seaborne oil supply (10-15 million net barrels per day) is in jeopardy. 
What started as a supply shock could very well result in demand destruction. 
During Covid, oil demand collapsed because people were in a lockdown. 
In a Hormuz closure, there is no lockdown, so price has to do the work.</p>

<p>Inventories may continue to be sharply drawn down. 
In March, the IEA agreed to conduct an emergency release of up to 400 million barrels to combat supply disruptions (more than double the 183 million unlocked after Russia invaded Ukraine). 
U.S. crude exports are up sharply as Europe and Asia diversify out of the Middle East. 
The U.S. is now a net crude exporter on a weekly basis for the first time in modern EIA data. 
The flow rate matters more than the headline barrel amount. Even a 3 million barrel-per-day SPR release would not be enough to offset the 10-15 million barrel-per-day Hormuz loss.</p>

<p><em>
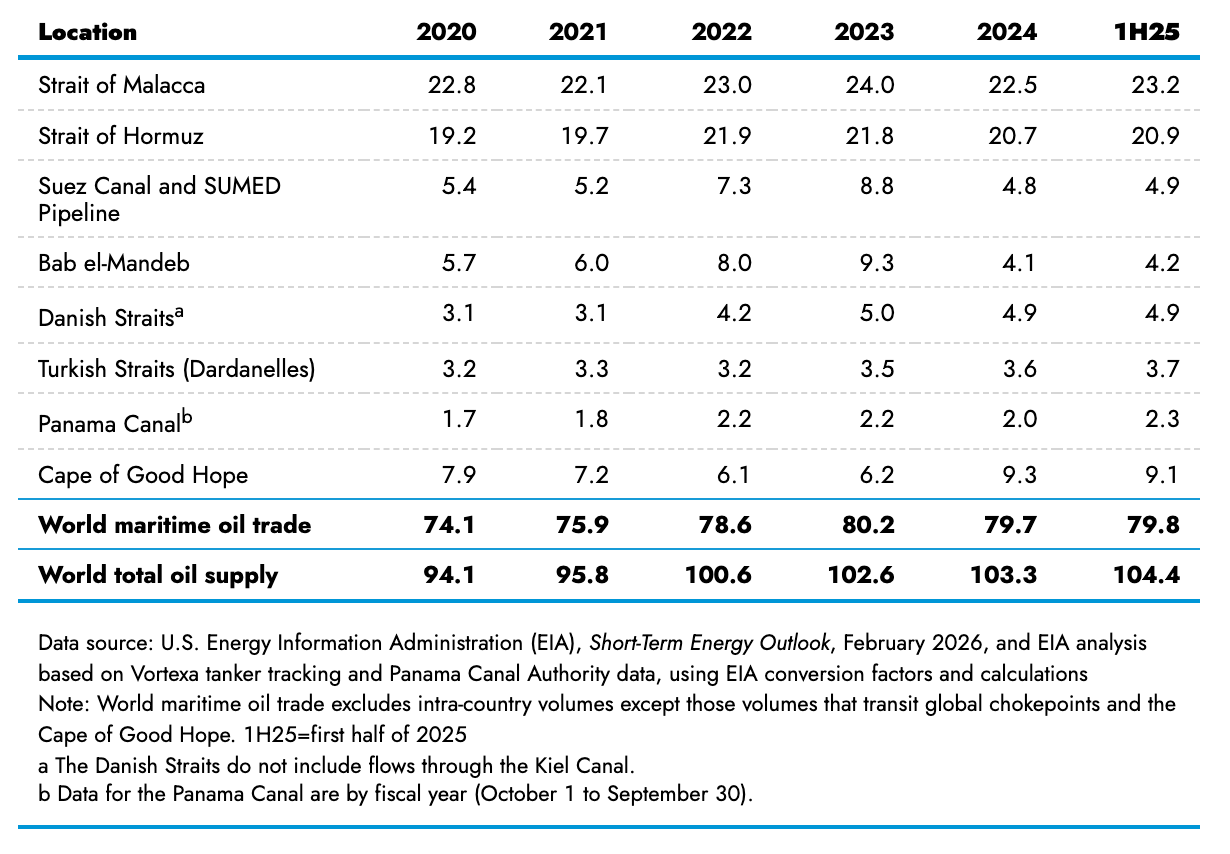
World oil chokepoints in mb/d:</em>
<img src="/assets/post3/chokepoints.png" alt="oilchokepoints" /></p>

<p>
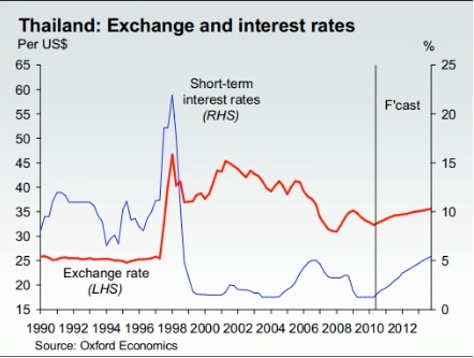
The Bank of England captured the macro situation well. 
The war in the Middle East has caused increased energy and commodity prices. 
It has raised near-term CPI through fuel, utilities, and business costs. 
Central banks cannot print more oil. 
Though gas spending may not be a large portion of real incomes, there are many linkages to higher prices via diesel, for example.</p>

<h3 id="a-less-obvious-link-and-the-downstream-effects">A Less Obvious Link and the Downstream Effects</h3>

<p>Oil is the first and most obvious expression of the shock. 
The second-order effects may offer more alpha since they are less direct and require a transmission mechanism. 
Why trade crowded headlines if you can trade the sequence?</p>

<p>
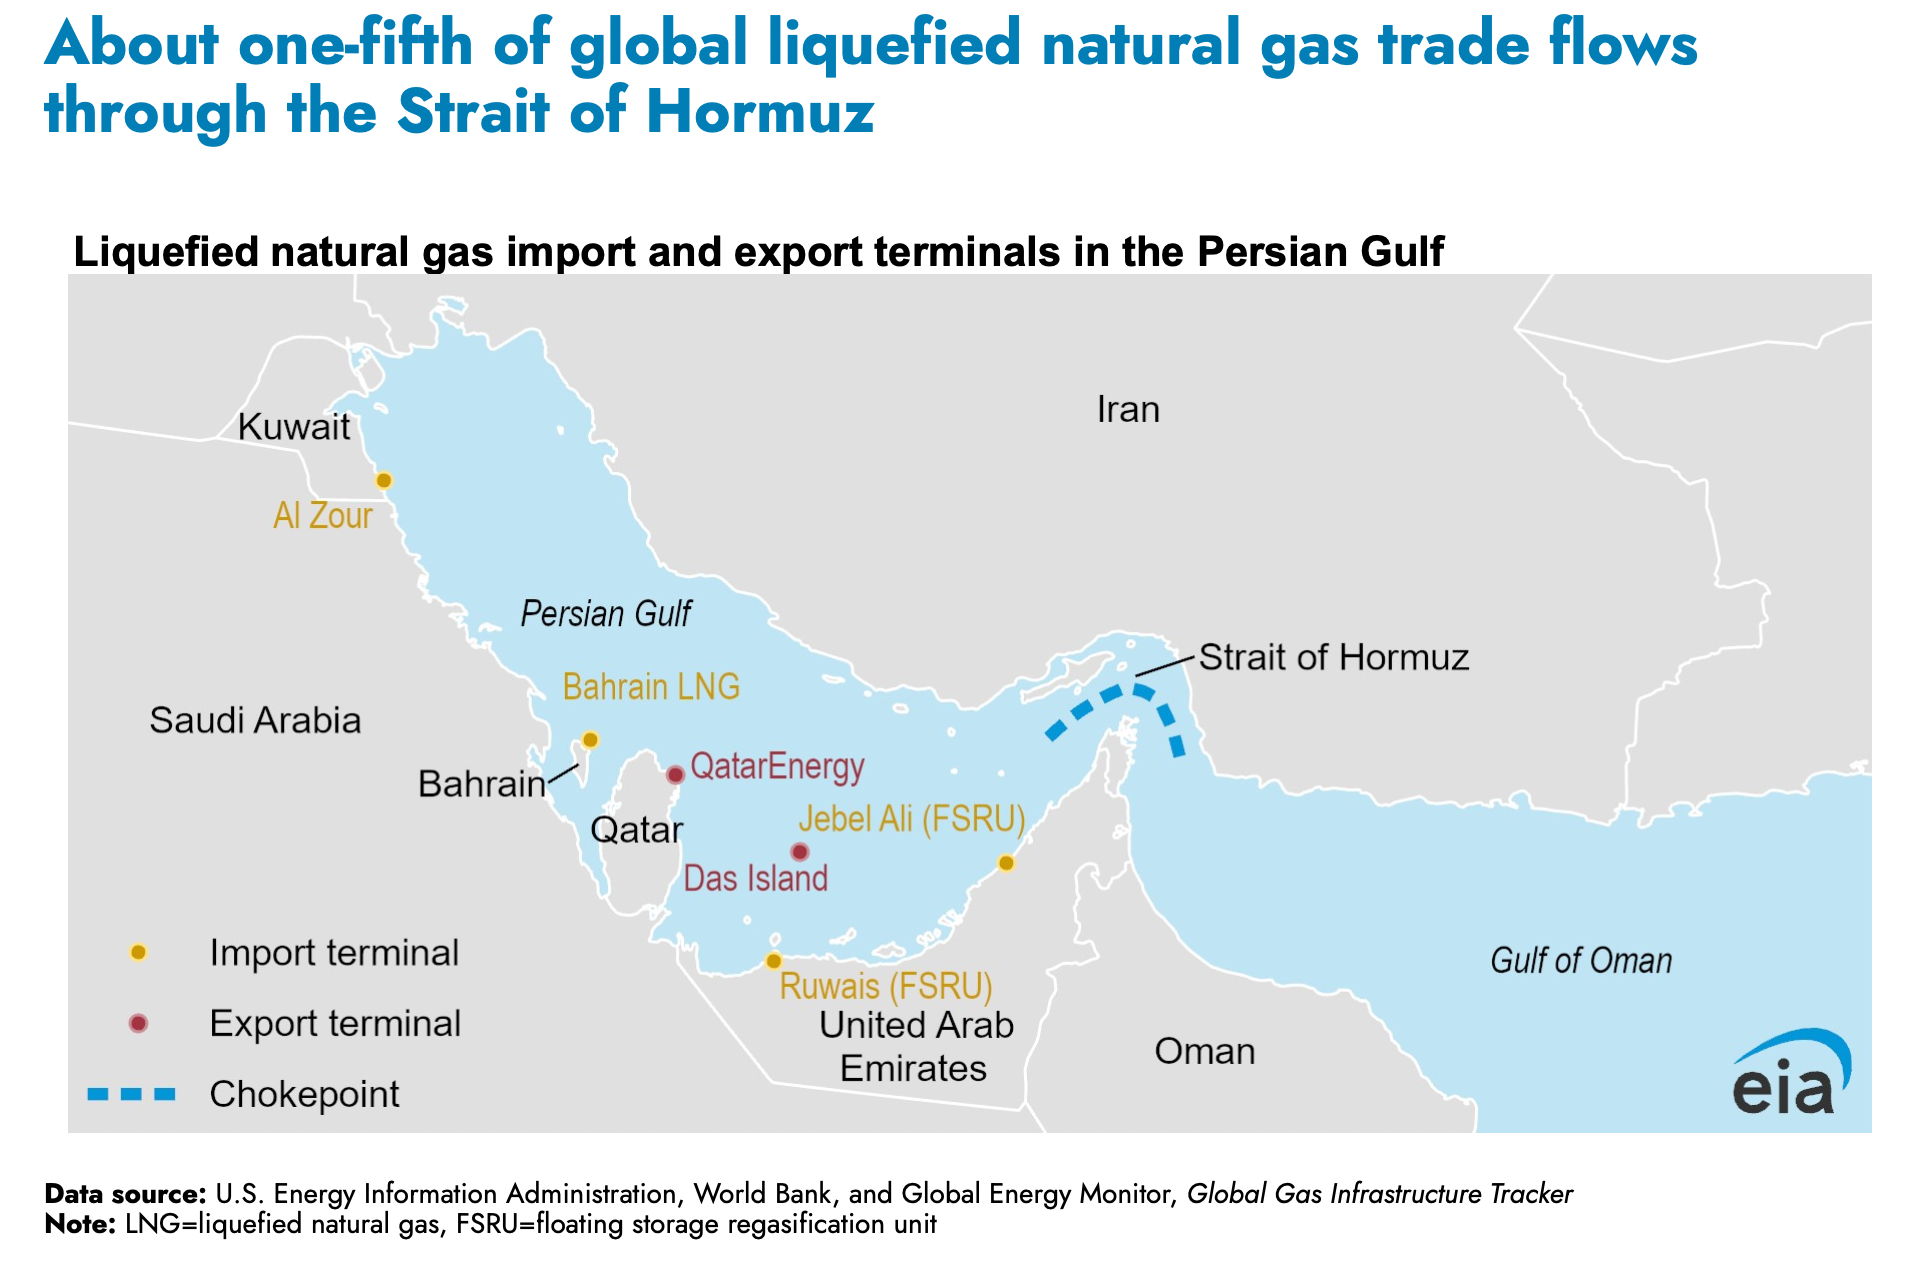
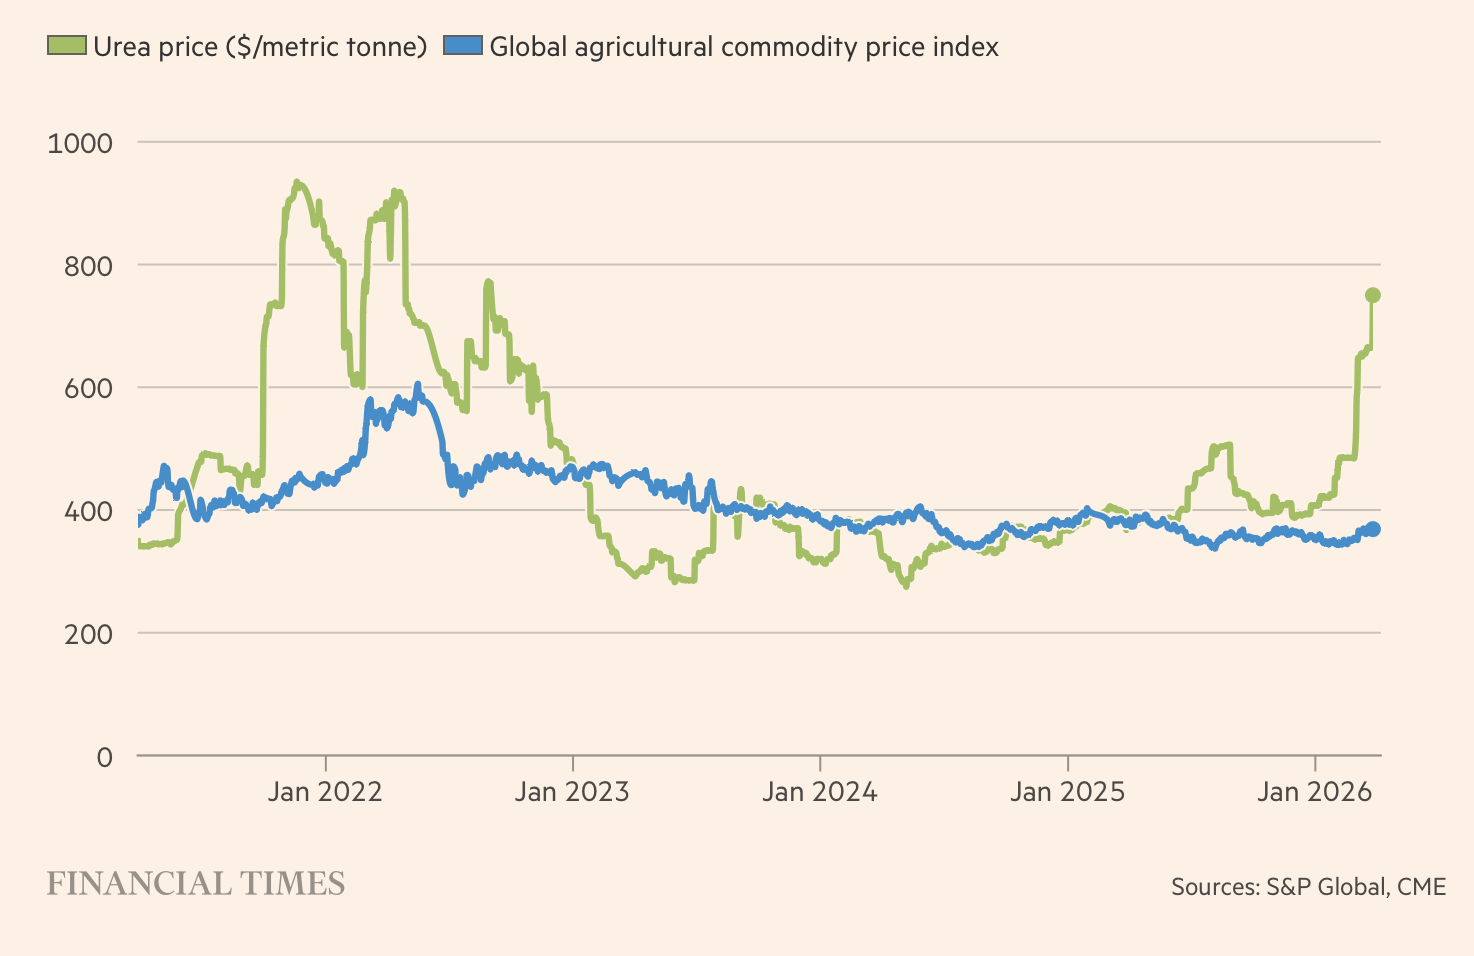
There is a transformation process from energy to fertilizer to food. 
Diesel is important for farm machinery, transport, and distribution channels. 
Natural gas is a key input for nitrogen fertilizer, especially ammonia (which is then used to produce urea). 
1/3 of global seaborne fertilizer passes through the Strait (unctad.org). 
Fertilizer plants in India and Bangladesh have shut down not because urea prices are high, but because the natural gas they need as an input is not arriving. 
For example, North Field is a facility in Qatar for LNG (liquefied natural gas) exports. 
It’s running at a fraction of capacity. When LNG is disrupted or LNG prices rise fertilizer producers face higher input costs. 
Urea prices have jumped significantly from prewar levels and U.S. fertilizer prices are up as well. 
Countries exposed to the Strait of Hormuz disruption or broader regional instability account for nearly 49% of global urea exports, according to The Fertilizer Institute.</p>

<p><img src="/assets/post3/LNG.png" alt="lng" />
<img src="/assets/post3/ureaprice.png" alt="ureaprice" /></p>

<p>Food prices don’t immediately move with oil. 
There is a lag. 
The price effect can emerge months after an energy shock. 
Farmers decide what to plant, how much fertilizer to use, and the weather/yields then determine supply. 
Each week of disruption affects future yields. 
Not having energy means production halts.</p>

<h3 id="wheat">Wheat</h3>

<p>Wheat is a staple food and is nitrogen dependent. 
When wheat supply looks threatened governments and importers act aggressively because bread prices are politically sensitive. 
Food price shocks are particularly destabilizing. You can use less electricity, but you can’t miss many meals. 
That means demand can be inelastic when countries fear future shortages.</p>

<p>Importers create higher demand for available wheat which leads to greater spot prices. 
Convexity comes from the possibility that wheat shifts from normal crop pricing to food-security pricing. 
In that regime, governments aren’t optimizing around price; they are trying to secure calories. 
The FAO said the March cereal price index is already up 1.5%, partially driven by higher fertilizer costs. 
Countries like Egypt, Pakistan and Bangladesh are particularly hard hit where they are short energy and short food. 
In some of these countries, food can account for nearly 40% of household spending (household surveys). 
Sulfur shortages also matter at the margin because sulfur is an essential plant nutrient that affects wheat yield and quality.</p>

<p><em>
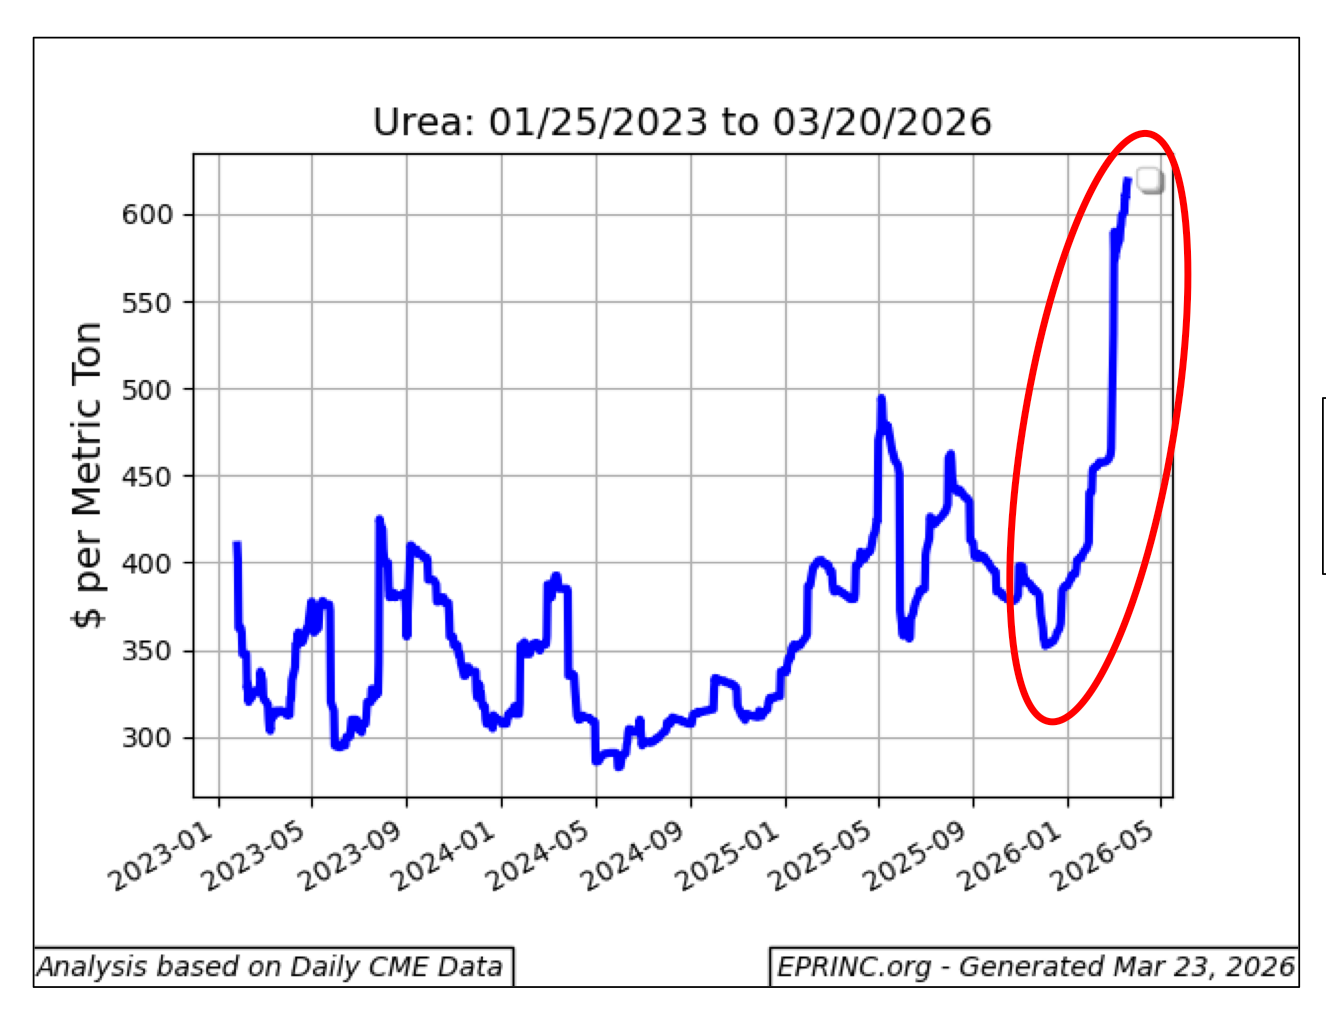
Fertilizer vs food price:</em>
<img src="/assets/post3/ureafood2.png" alt="ureafood" /></p>

<p>Wheat also doesn’t need a perpetual blockage to work. U.S. wheat acres and crop conditions are weak. 
The U.S. is planting little wheat compared to historical standards. 
The USDA projected wheat acreage at about 43.8 million acres, the lowest since records began in 1919 (National Agricultural Statistics Service). 
Wheat has some non-geopolitical support even if the Hormuz premium fades.</p>

<h3 id="sugar">Sugar</h3>

<p>
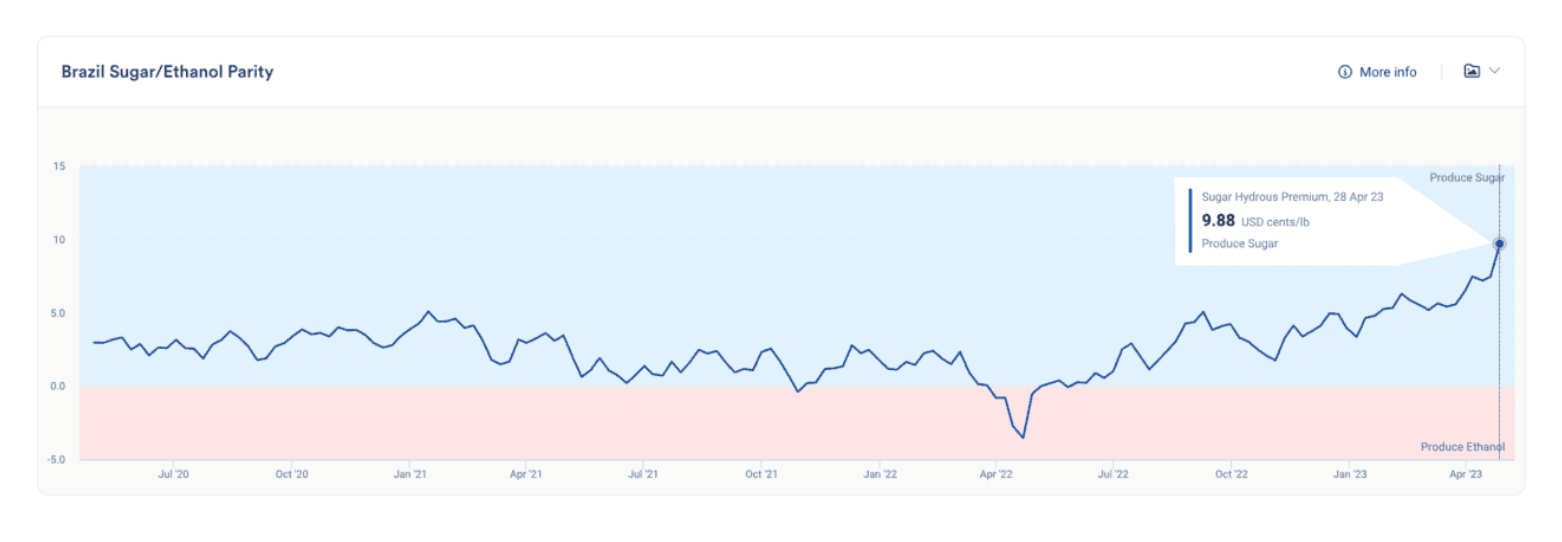
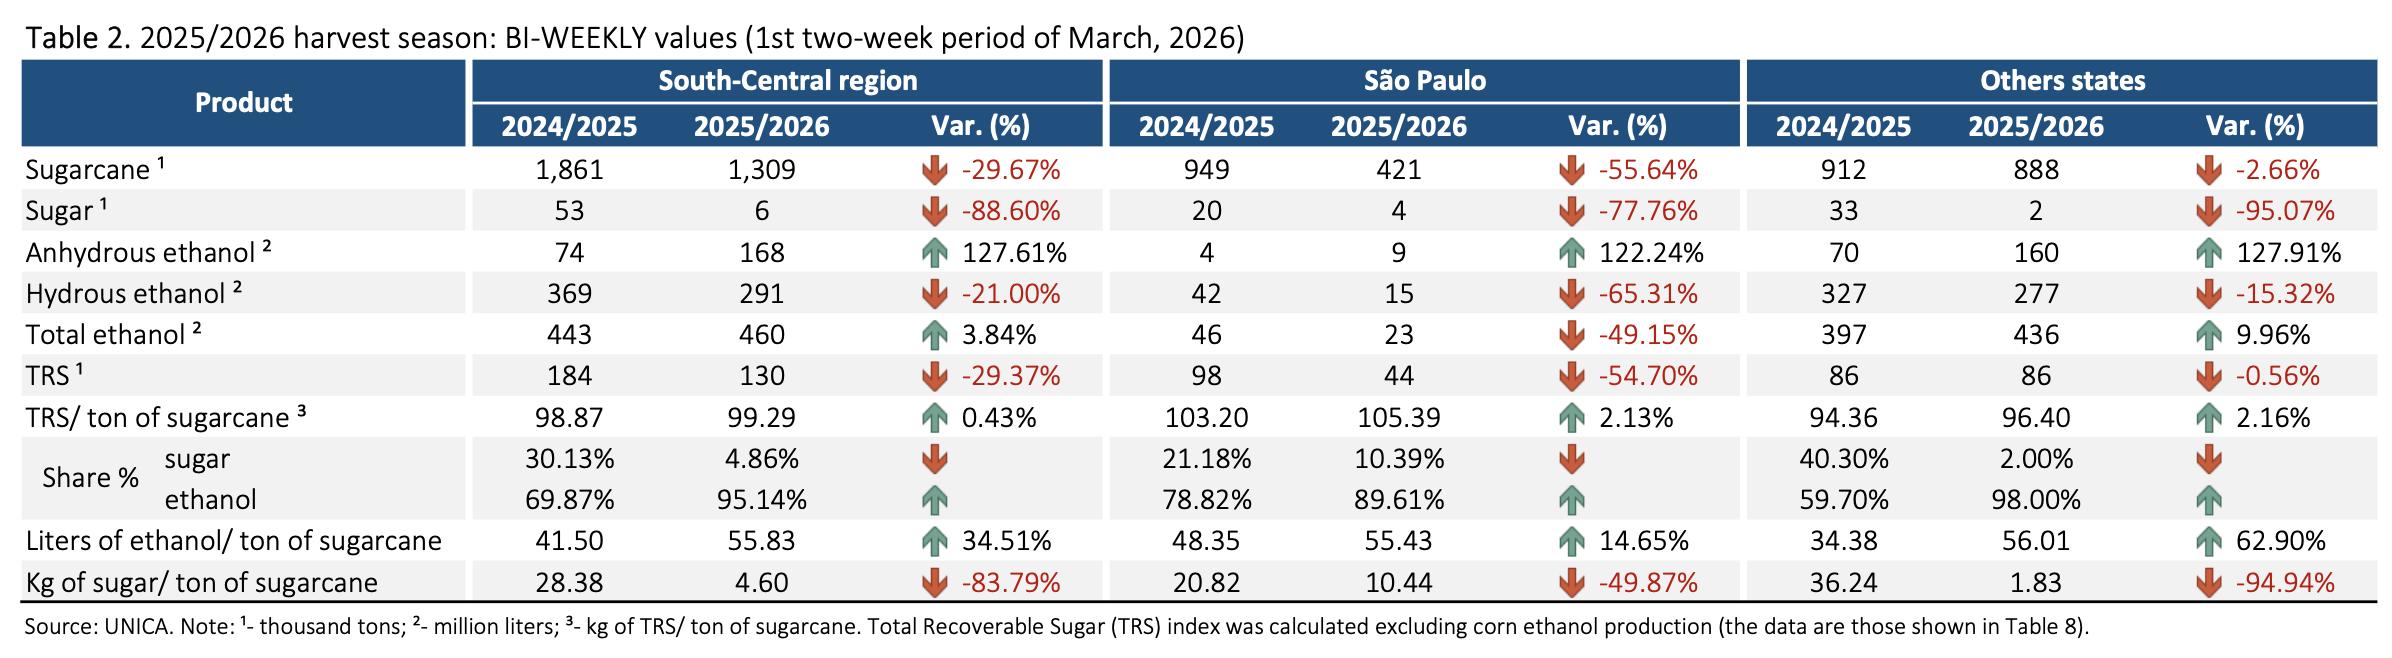
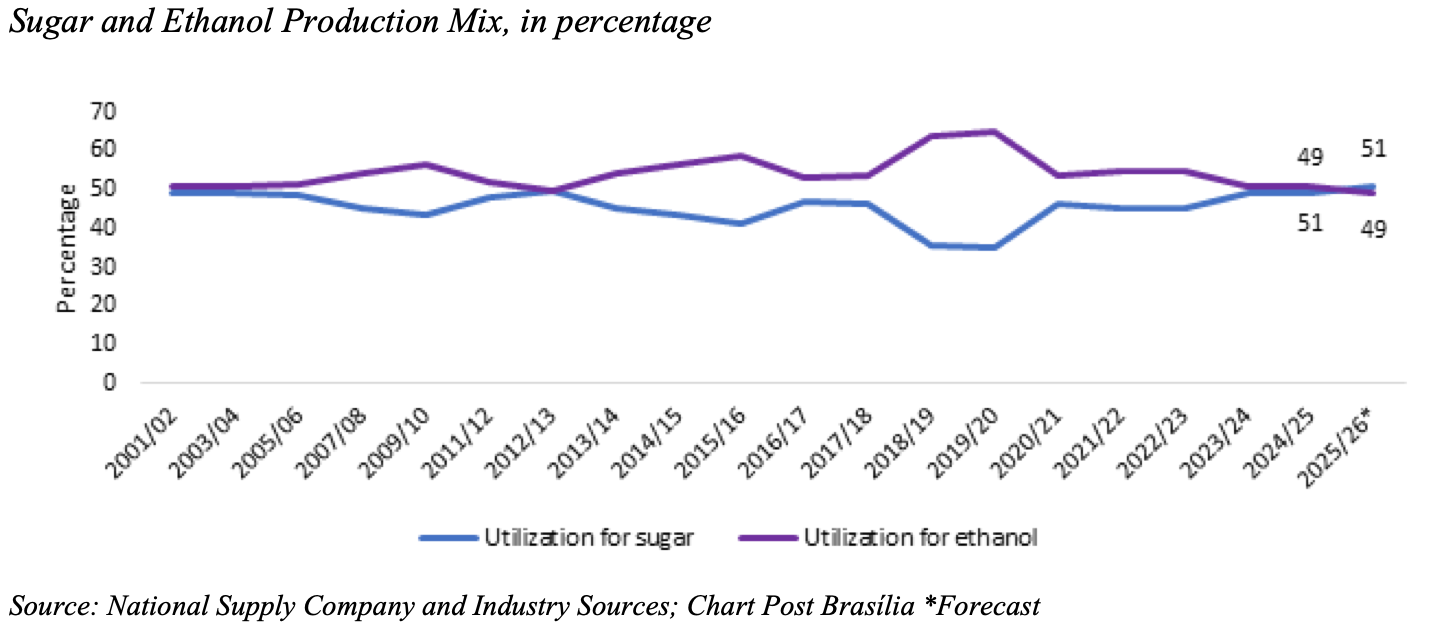
Sugar is less about urea and ammonia and more of an ethanol story. 
Brazil accounts for 40% of the world’s sugar exports. 
Mills in Brazil decide how much sugarcane to direct toward sugar production versus ethanol production. 
When oil prices rise, ethanol becomes more attractive. 
If margins improve, mills can allocate more cane toward ethanol and less toward sugar. 
Lower availability of sugar for export means higher global sugar prices. 
For example, an article from StoneX titled “Sugar Market Strength Faces Growing Supply Pressure Ahead” said that “sugar prices have moved above $0.15 per pound, driven by tightening supply conditions linked to energy markets and Brazil’s production decisions.” 
Wheat depends on weather, crop expectations, and food-security behavior. 
Sugar is fairly direct. However, there is a self-correcting feedback mechanism. 
Mills will shift back to sugar if sugar rallies a lot. 
That caps the upside move a bit. 
The above article also notes that strong production in Thailand and potential export flows from India could put downward pressure on prices.</p>

<p><img src="/assets/post3/brazilparity.png" alt="brazilparity" />
<img src="/assets/post3/unicasugar.png" alt="unicasugar" />
<img src="/assets/post3/brazilmix.png" alt="brazilmix" /></p>

<h3 id="the-trades">The Trades</h3>

<p>If the Iran situation quickly deescalates then the wheat premium may disappear, whereas a continuation with elevated fertilizer and fuel costs threatens future production. 
Sugar is also susceptible to higher prices the longer the strait is closed.</p>

<p>There may be an asymmetric risk/reward profile if options are pricing this as an oil only event. 
Consider winter wheat futures and fall sugar futures. 
I would prefer options on futures rather than outright futures because the downside is defined. 
A futures position requires ongoing margin and loses dollar-for-dollar as the contract moves against the thesis. 
A long call can expire worthless, but the maximum loss is the premium paid. 
That structure fits a path-dependent thesis where the timing and magnitude of the second-order shock are uncertain.</p>

<p>The problem with options could be skew (different implied vols at different strikes) where other traders would be pricing in some of the upside risk. 
Call spreads are interesting to reduce the skew cost. This is a convexity trade, not a certainty trade. 
Even though the outcome is not highly likely, if the bullish scenario happens, the move could still be larger than what the market is pricing.</p>

<h3 id="hedging-with-sonia-futures">
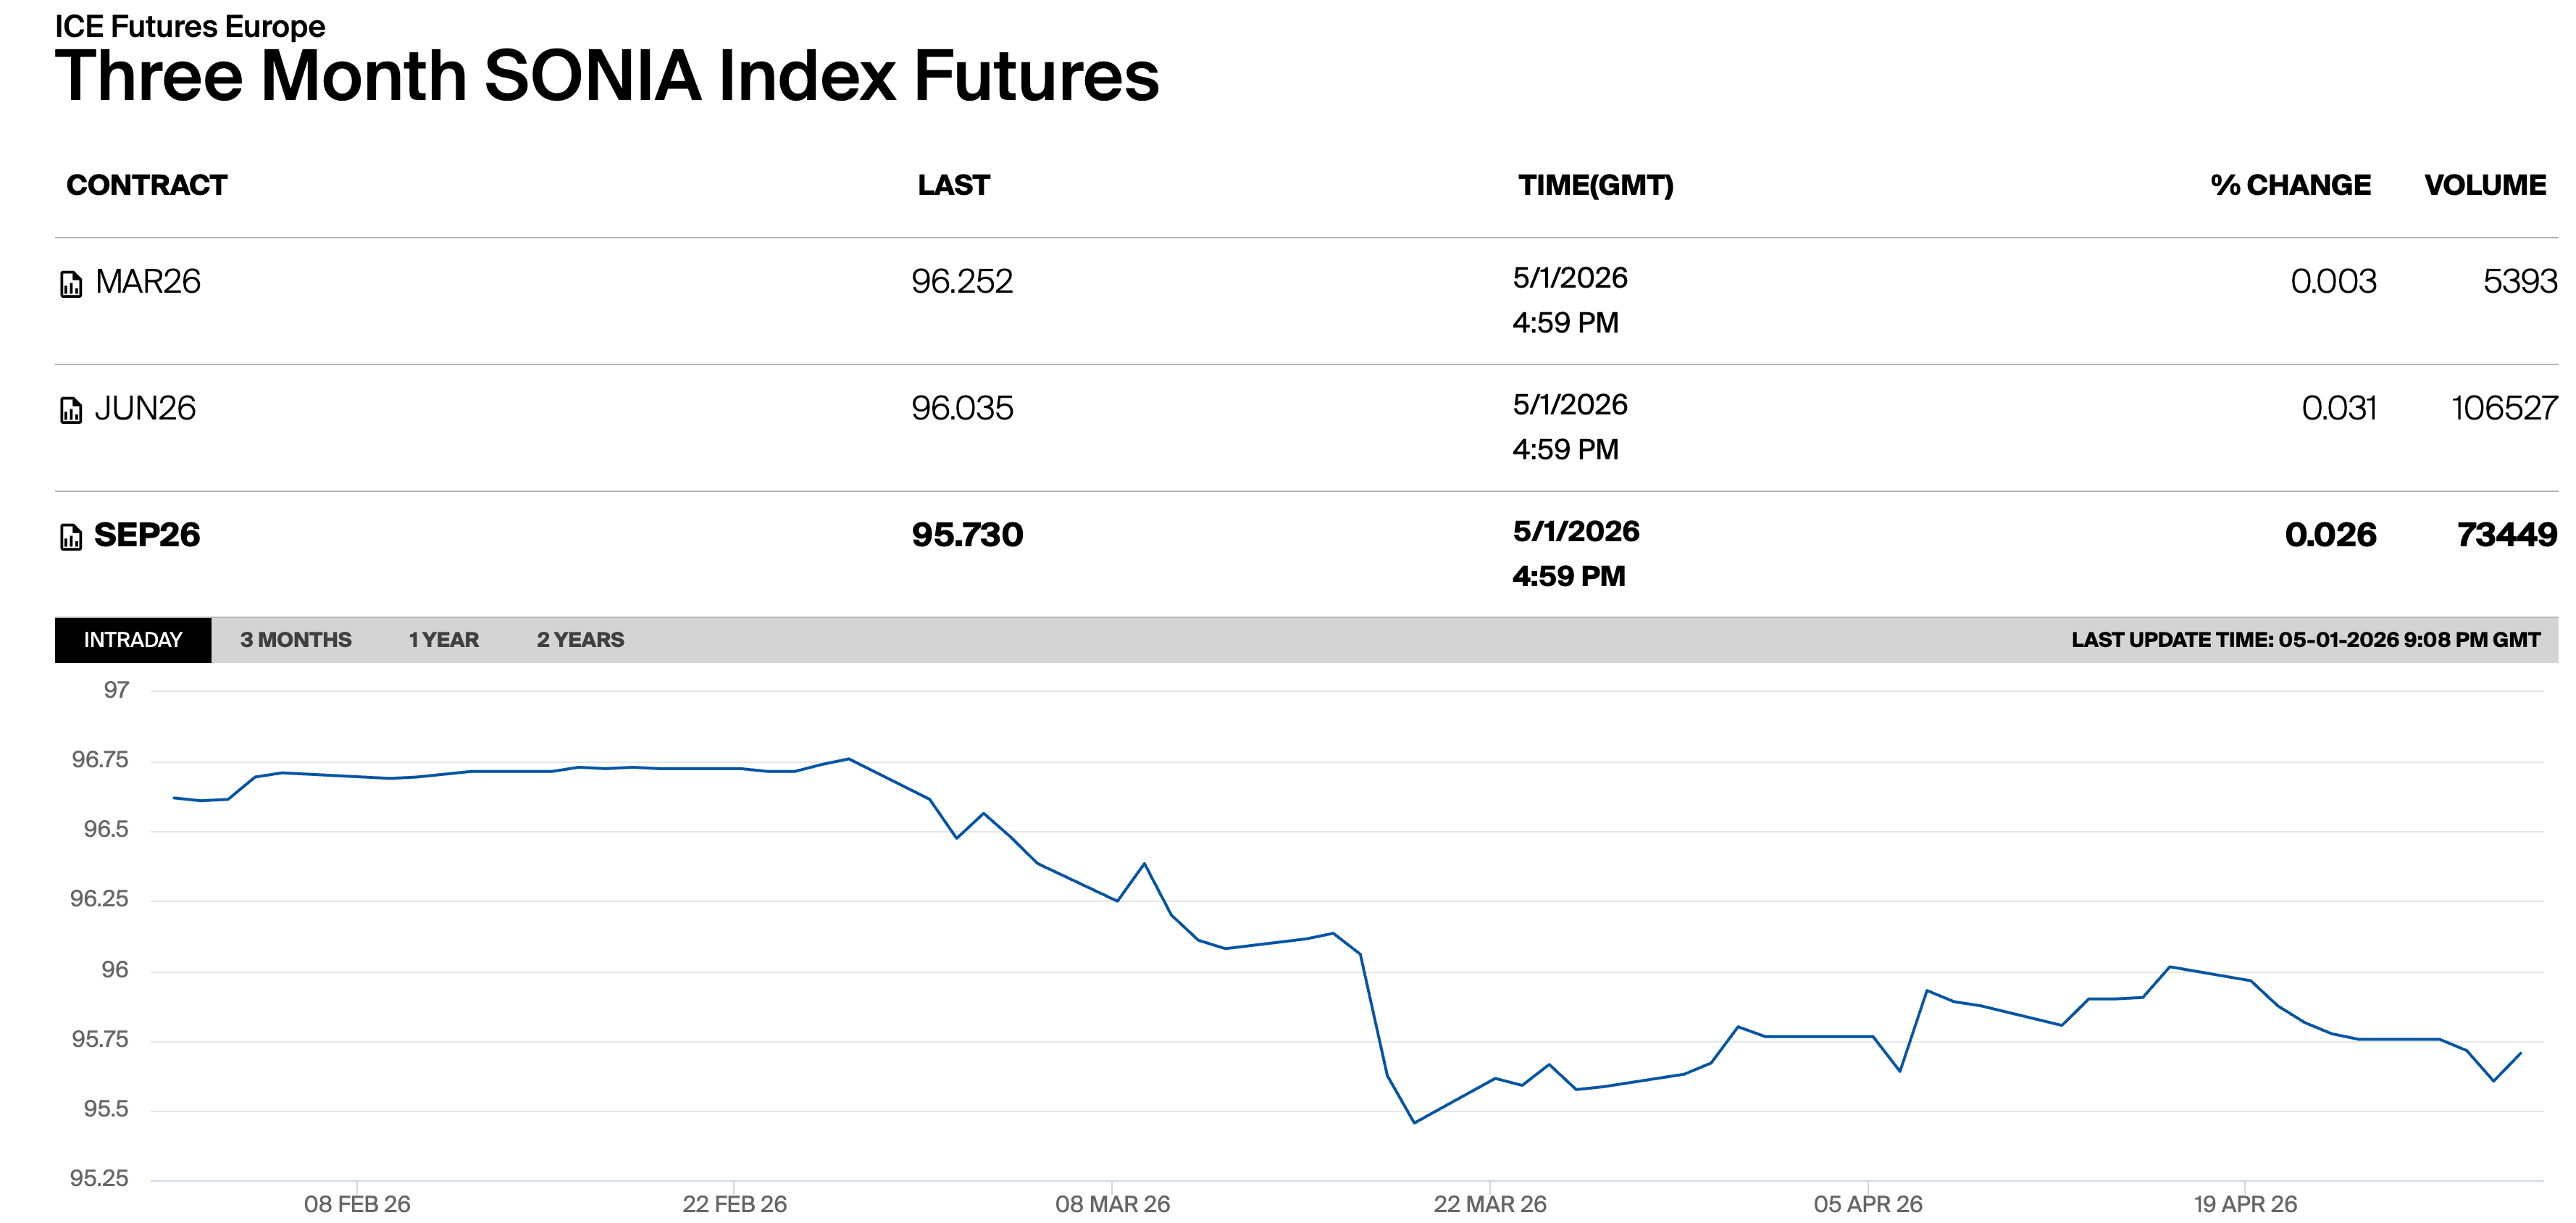
Hedging with SONIA Futures</h3>

<p>
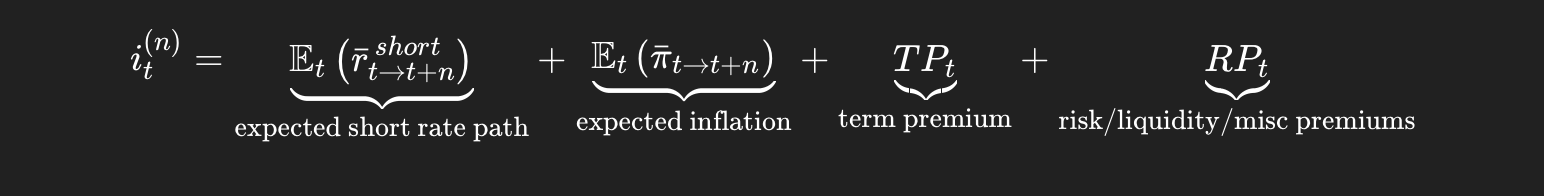
The natural hedge is on the rates side. 
SONIA, the Sterling Overnight Index Average, is the overnight sterling rate for actual overnight borrowing transactions. 
The U.K. is an energy-sensitive economy. An oil shock raises headline inflation and puts real incomes under pressure. 
Long SONIA futures gain when implied rates fall. So markets may price fewer cuts or even hawkishness because of an obvious inflationary impulse. 
But if the war deescalates, oil should fall and inflation pressure should fade. 
The front part of the curve is most sensitive to expected policy path, so if hikes are priced out and cuts or neutral policy are back in play yields should fall. 
Lower yields means higher bond prices. A short crude position is the more direct hedge, but it pulls the trade back into the market that this framework is trying to avoid.</p>

<p><img src="/assets/post3/soniafutures.png" alt="sonia" /></p>

<h3 id="where-the-trade-falls-short">Where the Trade Falls Short</h3>

<h4 id="fast-hormuz-de-escalation">Fast Hormuz De-escalation</h4>
<p>Peace arrives faster than expected. 
Even if U.S. wheat crop is not great, the panic premium can disappear quickly. 
Not only would a call lose directionally, but implied vol can also fall, which would be bad for the option price. 
The ethanol logic also weakens. The mills would have less reason to divert cane toward ethanol and away from sugar.</p>

<h4 id="market-pricing">Market Pricing</h4>
<p>The market may already be pricing wheat. 
If everyone bought wheat calls since they know wheat is a “food security commodity” then upside call skew is expensive. 
You could be overpaying for the option.</p>

<h4 id="weak-import-panic">Weak Import Panic</h4>
<p>The wheat panic buy actually needs to show up. 
MENA (Middle East and North Africa) importers may draw down inventories, delay purchases, or diversify suppliers. 
The panic bid may be weaker.</p>

<h4 id="sugar-surplus">Sugar Surplus</h4>
<p>Global surplus can absorb the shock. 
There’s anywhere from a 5 million to 11 million metric tonne surplus depending on the informational source. 
The market has a buffer. Sugar could rally a little but maybe not enough for expensive calls to pay.</p>

<h4 id="rates">Rates</h4>
<p>Higher rates can lead to a stronger dollar. 
That would raise carry costs and pressure emerging-market importers and offset some of the bullish supply-side story.</p>

<h4 id="sonia-hedge-failure">SONIA Hedge Failure</h4>
<p>SONIA is not a perfect hedge because sticky wage and services inflation can keep the BoE hawkish.</p>

<h3 id="conclusion">Conclusion</h3>

<p>The reason I would rather look for convexity in wheat and sugar than simply buy crude is that oil is the obvious trade. 
It is liquid, crowded and reprices immediately when Hormuz risk rises. 
The potential alpha is in the commodity transmission channels: LNG and fertilizer availability, diesel costs, food-security buying, and Brazilian ethanol allocation. 
Oil is just the headline.</p>]]></content><author><name></name></author><summary type="html"><![CDATA[This post is an example of how to turn a geopolitical shock into a cross-asset framework: identify the obvious trade, look for lagged transmission channels, express the view with a defined downside, and hedge the scenario. The Iran war has been priced first as an oil shock, but the more interesting question is whether it becomes a commodity, food, and rate shock.]]></summary></entry><entry><title type="html">Debt Mechanics and the Dollar</title><link href="https://zgmacro.com/2026/04/26/Debt-Mechanics-and-the-Dollar.html" rel="alternate" type="text/html" title="Debt Mechanics and the Dollar" /><published>2026-04-26T00:00:00+00:00</published><updated>2026-04-26T00:00:00+00:00</updated><id>https://zgmacro.com/2026/04/26/Debt%20Mechanics%20and%20the%20Dollar</id><content type="html" xml:base="https://zgmacro.com/2026/04/26/Debt-Mechanics-and-the-Dollar.html"><![CDATA[<p>History is replete with currency crises like Thailand in 1997, Latin America in the 1980s, or the 1998 Russian financial crisis. 
Such problems tend to happen in countries that are reliant on capital inflows, so a large portion of the debts are denominated in foreign currencies. 
The effects of currency devaluations are severe and may include much higher import costs, a large GDP gap, and banking crises. 
Devaluations can stem from capital flight. This might be caused by a concern about the real return on the government debt from a supply/demand imbalance, tighter monetary policies abroad, or geopolitical/economic concerns.</p>

<p>Let us consider the various methods through which policymakers work to stimulate an economy. 
The first is a reduction of interest rates. 
There exists a zero lower bound (ZLB) since cash has a nominal interest rate of 0 (liquidity trap). 
When that doesn’t work, governments utilize a second method which includes QE, artificially lowering yield and perhaps mispricing risk (more on that later from The Price of Time by Edward Chancellor). 
The BOJ pioneered QE in 2001. Such actions also tend to widen the wealth gap as seen in the last decade by benefitting asset holders. 
To help borrowers, a government can pursue a third type of monetary policy. 
Fiscal-monetary coordination includes central banks financing fiscal spending. 
For example, we saw something close to “helicopter money” during Covid-19.</p>

<h3 id="thailand">Thailand</h3>

<p>In Thailand, a strong reliance on foreign capital flows led to a high share of foreign debt as a percentage of GDP (51% by the mid 90s). 
The hot money fueled a leveraged bubble which spread to Malaysia and Indonesia. 
The current account deficit ballooned as individuals were long the baht through consumption channels. 
As asset prices at the peak of the bubble neared a Minsky moment, the economy was vulnerable to capital flight. 
A balance of payments crisis emerged by 1996 and a credit crunch ensued.</p>

<p>To defend its currency the Bank of Thailand (BOT) drew down foreign exchange reserves to buy baht. 
Of course, this was unsustainable as there (usually) exists a finite amount of the reserves. 
Another solution is to increase interest rates. 
This may also be unsustainable as higher interest rates slow an economy as borrowing becomes more expensive and fixed income assets lose value. 
Moreover, larger currency devaluations over shorter periods of time require higher annualized interest rates to defend (as can be represented by a compounding power function). 
To avoid spending down reserves or too high interest rates a currency is eventually devalued.</p>

<p><img src="/assets/post2/baht.jpg" alt="baht" /></p>

<p>The consequences were severe for Thailand including the resignation of the prime minister, 64% of finance and securities companies shut down, the takeover of 27% of Thai banks, a lending contraction, and threats to the democracy. 
Notably, Thailand and other Asian countries took significant loans from the IMF during the crisis.</p>

<p><img src="/assets/post2/protest.jpg" alt="protest" /></p>

<p>Hedge funds, including Soros’s Quantum Fund, built large short positions and profited from the crisis. 
While expecting a depreciation one could borrow Baht and sell it for dollars, and then buy the Baht back more cheaply while repaying the loan. 
Investors used FX swaps and forward contracts.</p>

<h3 id="theoretical-framing">Theoretical Framing</h3>

<p>First-generation stories emphasize weak fundamentals such as external deficits and reserve loss. 
Second-generation stories emphasize self-fulfilling crisis dynamics, where investors attack because they believe others will. 
Third-generation views focus on financial-sector fragility, moral hazard, and private-sector balance-sheet mismatches. 
The third view is convincing. 
Thai banks and finance companies borrowed short term, often in foreign currency, and lent long term into domestic real estate. 
That led to mismatches on the currency side where liabilities were in dollars and assets/income was in Baht.
On the maturity side short-term funding backed long-term, illiquid investments. 
If Thailand only had an overvalued exchange rate devaluation could have been painful but manageable. 
The financial system was unable to function with the devaluation. The chain reaction follows:</p>

<p>1) Investors doubt the peg
2) The central bank loses reserves defending it
3) Baht devalues
4) firms with unhedged foreign-currency debt experience larger debt burdens
5) Property prices fall
6) Nonperforming loans rise
7) Companies fail and credit contracts</p>

<h3 id="us-dynamics">U.S. Dynamics</h3>

<p>There are arguments for a gradually weaker dollar. 
The U.S. does not defend a hard peg, borrows in its own currency, and the dollar is the primary reserve currency. 
That said currencies become weaker as confidence in the policy framework erodes and markets become less willing to finance external imbalances.</p>

<p>Economist Erik Nielsen recently laid out a thoughtful framework for understanding a potential decline in the dollar. 
The U.S. runs large fiscal deficits, has a lot of public debt as a percentage of GDP, and depends on demand for treasuries from abroad. 
He says first it’s hard to lower spending. 
If the U.S. wanted to cut spending to half the deficit, it would have to eliminate 2/3 to 3/4 of all discretionary spending. 
There are also high interest costs relative to taxes as indicated by the interest to revenue ratio. 
Secondly, deficits led to a problem with the U.S. net international investment position (NIIP). 
NIIP is now -85% of GDP. Lastly, erratic U.S. policy is likely to drive less capital inflow in the context of a fragmented geopolitical environment. 
As a result, he projects higher U.S. yields as foreigners require larger compensation as the dollar weakens. 
One might want to distinguish a potential bear market for the dollar from the end of the dollar reserve system. 
He doesn’t argue the dollar will no longer be the reserve currency and there is no mention of “BRICS” taking over. 
Though one might keep in mind instances of the U.S. weaponizing treasuries in geopolitical conflicts.</p>

<h3 id="cant-the-fed-buy-forever">Can’t the Fed Buy Forever?</h3>

<p>The U.S. is more likely to deal with debt stress through inflation and financial repression. 
A cycle may emerge where higher debt servicing costs leads to more debt needing to get issued. 
As a backstop, the central bank can simply buy the debt. 
However, inflation appears to be the limiting factor wherein the real return is no longer a viable investment for holders of the debt. 
Such a dynamic would be self-reinforcing where holders would sell debt, worsening the supply demand imbalance and raising inflation expectations.</p>

<p>When the Fed buys government debt via the secondary market, it creates money via the increase in bank reserves. 
That can indirectly lead to more lending and deposit creation, but M2 doesn’t necessarily rise one for one. 
QE does not increase real productive capacity. Land, labor, and capital don’t just appear out of nowhere. 
More dollars chasing fewer goods means higher inflation. 
If investors think the Fed will always print then they’ll expect inflation and yields would have to rise. 
Instead of keeping borrowing costs low, the exact opposite would happen if credibility were to break. 
That’s part of the reason why TIPS (treasury inflation protected securities) are interesting. 
Gold is another interesting discussion I can save for another post.</p>

<p>A more detailed view of the long term bond market would say that the nominal yield on an n-year bond would equal the average expected real short rate + the average expected inflation + the term premium + the inflation risk premium + the liquidity premium. 
As marginal demand for treasuries becomes less elastic increased compensation may also be required via higher term premia on long term bonds.</p>

<p><img src="/assets/post2/bondyield.png" alt="bondyield" /></p>

<p>There are good arguments supporting the dollar’s role in the reserve system. 
In periods of global stress, the dollar usually strengthens. 
U.S. asset markets are deep and liquid. 
The U.S. attracts a ton of capital due to favorable corporate profitability dynamics and tech leadership. 
Consider the exposure global investors want to U.S. tech, venture, and public equity. 
The IMF and BIS show that the dollar still accounts for over 80% of trade finance and nearly 60% of FX reserves. 
There is no good substitute right now. Some might even say the dollar is not overly expensive. 
It recently fell to a 4 year low. Relative rates and asset returns favor the dollar. 
The U.S. 10-year was recently at 4.34% while comparable German bunds trade at 2.91% and Japanese bonds at 2.35%.</p>

<p>While I’m not here to predict exactly where the dollar is headed, the dollar is not a simple exchange rate. 
It reflects the price of access to the global financial system. 
The dollar may weaken if markets start to believe U.S. debt will be managed in a way that reduces real returns. 
In any case, a deficit of 6% of GDP may be unsustainable over the long term unless nominal growth sufficiently exceeds nominal interest rates.</p>

<p><img src="/assets/post2/linearizeddebt.png" alt="debtgdp" /></p>

<p>dt is the debt to GDP ratio and delta d is the change in debt to GDP as measured by current period debt to GDP minus previous period debt to GDP. 
r is the nominal interest rate and g is the nominal growth rate. 
Pt is the primary deficit as a percentage of GDP. 
When r exceeds g debt to gdp tends to rise. When g exceeds r debt to GDP tends to fall. 
Running a large deficit increases P. 
In the long run U.S. pattern has been g&gt;r; however, post-covid r and g became less favorable for U.S. debt dynamics. 
R is probably a lot closer to g than it used to be.</p>

<p>America’s danger is a less sudden Thai-style currency crash than a slow shift in which the world stops treating treasuries as neutral plumbing. 
Once r stops sitting comfortably below g, fiscal dominance starts to look like a currency story.</p>]]></content><author><name></name></author><summary type="html"><![CDATA[History is replete with currency crises like Thailand in 1997, Latin America in the 1980s, or the 1998 Russian financial crisis. Such problems tend to happen in countries that are reliant on capital inflows, so a large portion of the debts are denominated in foreign currencies. The effects of currency devaluations are severe and may include much higher import costs, a large GDP gap, and banking crises. Devaluations can stem from capital flight. This might be caused by a concern about the real return on the government debt from a supply/demand imbalance, tighter monetary policies abroad, or geopolitical/economic concerns.]]></summary></entry><entry><title type="html">Lessons from 1996</title><link href="https://zgmacro.com/2026/04/16/Lessons-from-1996.html" rel="alternate" type="text/html" title="Lessons from 1996" /><published>2026-04-16T00:00:00+00:00</published><updated>2026-04-16T00:00:00+00:00</updated><id>https://zgmacro.com/2026/04/16/Lessons%20from%201996</id><content type="html" xml:base="https://zgmacro.com/2026/04/16/Lessons-from-1996.html"><![CDATA[<p>On December 5, 1996, Federal Reserve Chair Alan Greenspan asked a now-famous question: 
“But how do we know when irrational exuberance has unduly escalated asset values?”</p>

<p>This warning from Greenspan later got attached to the dot-com bubble. 
He identified it early, but the market’s response over the next few years reveals an uncomfortable truth: being right about a bubble is not the same thing as being able to profit from one.</p>

<h3 id="the-market-didnt-care">The Market Didn’t Care</h3>

<p>After the speech, the NASDAQ didn’t correct. Instead, it went up. In December of 1996 the Nasdaq was at about 1,100 and by March of 2000 it peaked at roughly 5,048.</p>

<p><img src="/assets/post1/nasdaq.png" alt="nasdaq" /></p>

<p>Even if you had correctly assessed the situation and shorted tech or the index, you would have been destroyed by the timing. For example, LEAPs would have expired worthless even with the reduced time decay. If you went short by borrowing shares, then margin requirements, volatility and drawdowns would likely force liquidations and put you out of business.</p>

<h3 id="structural-difficulties-with-shorting-bubbles">Structural Difficulties with Shorting Bubbles</h3>

<p>Bubbles are partially driven by liquidity dynamics. Falling real interest rates, easy credit conditions and passive flows can overwhelm valuations for many years. Even if capital doesn’t price risk rationally, it can be pushed into equities via structural mechanics. Big firms buying back shares and retirement systems passively buying an index ignore valuation metrics. Buying often occurs via market cap weighting. So, it’s not a question of “is this stock cheap or expensive?” Instead, we get buying pressures on the largest stocks. Bubbles are reflexive in nature. Rising prices create conditions for further rises. When assets increase in price, balance sheets improve while raising collateral values. That leads to more borrowing, higher leverage, and more inflows.</p>

<h3 id="timing-matters-more-than-correctness">Timing Matters More Than Correctness</h3>

<p>Shorting a bubble isn’t a binary call. Upside on short trades is limited by the price of the stock. If I buy a put option, the lowest a stock can fall is to 0. With calls, the upside is infinite. In some situations going short via borrowing shares can come with unlimited downside risk. Losses are marked daily (hello private credit!). A manager who is early can look indistinguishable from a manager who is wrong, which is why many investors prefer to reduce exposure, diversify, or rotate rather than make an all-or-nothing bearish call.</p>

<p>Markets can stay irrational longer than you can stay solvent, so your position bleeds even with a correct thesis. Druckenmiller shorted $200 million in internet stocks in March 1999. In three weeks, he covered them at a 600 million dollar loss. Upon recalling the story, he said, “Frankly, I’m not sure I’ve ever made money in shorts. I’ve never had a down year, but I’m not sure I’ve made money in shorts. I like it. It’s fun. But you can get your head handed to you.” GMO LLC led by Jeremy Grantham was skeptical of tech valuations in the late 90s. They were underweight tech, but stayed invested overall. They still massively underperformed at the peak until the vindication came in 2000-2002. When the bubble burst and many unprofitable tech companies went to zero the non tech exposures held up much better. They avoided the worst of the drawdown in the speculative areas. Grantham’s reflection of the episode sounds something like “You can be fundamentally right and still lose clients before you win money.” Going fully defensive too early means underperforming for years before a burst.</p>

<h3 id="what-actually-works">What Actually Works</h3>

<p>Investors who successfully navigated the dot-com era tended to do a couple of different things correctly. 
I think we can divide groups into two camps: those who didn’t lose a lot of money, and those who made successful investments on the way down. 
For the first group ideas include reducing exposure gradually, rotating away from extreme valuations, holding diversified portfolios, and avoiding too much leverage. 
The second group is interesting. The bursting of a bubble requires a catalyst that will reverse the dynamics that led to the bubble in the first place. A list might include an interest rate shock, credit tightening, geopolitics, and a refinancing wall. It usually causes a chain reaction in which financing conditions, fundamentals, and positioning begin to work against each other at the same time.</p>

<p>After a global currency crisis in 1998 and subsequent rate cuts, the Fed began raising rates in 1999. Rates peaked on May 16, 2000 at 6.5%. Tech valuations were based on future cash flows. Higher rates mean higher discount rates, which translates to a lower present value of those cash flows. By late 1999 cracks appeared in fundamentals. Dot-com firms who never achieved profitability and had a “growth at any cost” mindset began to show diminishing returns. Moreover, IPO performance started to weaken which led to reduced venture funding. By the end of it, concentration risk inside the indices amplified the downturn. Index-linked selling amplified the downside. Once the narrative broke, it went from “new economy” to “maybe this time isn’t different.”</p>

<h3 id="today">Today</h3>

<p>The Shiller PE ratio is at 40.57. Valuations are high. There’s no doubt about that. In the dot-com bubble the NASDAQ was dominated by companies with no earnings and unclear business models. 
Today’s expensive market features mega-cap leaders that are highly profitable with strong free cash flow and margins. Large tech firms have strong balance sheets though we’ve started to see a lot of long-term bond issuance.</p>

<p><img src="/assets/post1/pereturns.png" alt="pe returns" /></p>

<p>Now whether the AI buildout will show returns that investors have come to expect is a different story. The AI capex cycle is insane. Spending is skewed towards data centers, GPUs, and high bandwidth memory. AI capex is growing much faster than AI revenue, putting pressure on firms to prove long-term ROI. If AI utilization does not meet expectations the capital deployed could lead to significant depreciation. You can find research to support any narrative - AI capex is overextended, or it’s durable and here to stay. One thing is for certain - a huge portion of earnings growth is now tied to AI spending.</p>

<p>AI may be real enough that the better trade is not trying to short the most overpriced stocks, but looking downstream at the bottlenecks. If Aschenbrenner is right that AI has become an industrial process - giant clusters, power plants, fabs, and eventually gigawatt-scale infrastructure - then the second-order plays in power, cooling, optics, grid equipment, and memory deserve attention. Amodei’s warning is on the other side of that trade: capability can compound faster than the economy can absorb it, and the capex math becomes dangerous if companies buy compute for a demand curve that arrives even a year late. The lesson from 1996 is that the theme can be right, the infrastructure cycle can be real, and the valuation can still leave little room for error.</p>

<p><em>However there’s been nothing quite like the railroad buildout (so far):</em>
<img src="/assets/post1/buildout.jpeg" alt="buildout" /></p>

<p>An interesting trend that’s recently come under scrutiny is the Yale endowment model’s impact on institutional portfolio holdings. Previously, in the 1970s and 80s we had maybe 50/50 exposure to public equities and bonds with minimal exposure to private markets. That’s good when stocks and bonds aren’t correlated (#2022). Inflation eroded bond returns and institutions weren’t meeting long-term spending needs. Enter Swenson. He came into the picture in 1985 and, over time, moved Yale more heavily into private equity / venture capital, hedge funds, and real assets. The portfolio was revolutionary at the time and was characterized by a large percentage in alternatives and a low allocation to traditional fixed income. And it worked. Yale could lock up capital for 10+ years, focus on selecting strong managers, and diversify beyond stocks/bonds.</p>

<p><img src="/assets/post1/yalecomposition.png" alt="yale" /></p>

<p>The model reshaped global markets. Massive capital flowed into private equity and venture capital, and hedge funds became mainstream investment vehicles. Ok so everyone copied Yale. Now what? There’s been a lot of crowding, less access to top tier managers, and illiquidity risk. Public markets also got more efficient which led to low-cost indexing outperformance. Illiquid portfolios are harder to value, harder to benchmark, and are dependent on manager narratives. As a result, there’s less transparency and more room for optimistic assumptions. Early in a downturn portfolios look artificially stable and less volatile than public markets since private markets don’t fully adjust right away (“volatility laundering”). Since portfolios appear less risky than they are and volatility is understated there’s risk for complacency. In a downturn, IPO markets shut, M&amp;A slows and buyers demand lower prices. Inflows collapse right when outflows persist. What happens when exits slow or stop? Bubbles aren’t just about prices overshooting - they’re about liquidity conditions that feel permanent until they suddenly aren’t.</p>

<p><img src="/assets/post1/peaum.png" alt="peaum" /></p>

<p>The dot-com bubble showed that being right about excess isn’t enough. Today’s AI capex boom and private markets reflect a similar dynamic: the narrative may be up for debate, but as long as capital keeps flowing, the system can persist. The real challenge is finding a catalyst. Even central banks do not have a reliable mechanism to find it. Many people in 2023 thought interest rates would do the trick. While there are likely many good opportunities in U.S. tech, especially in second-order AI-related infrastructure bottlenecks, I remain cautious at these valuations. The question is not whether U.S. equities deserve to trade richer than the rest of the world, but to what extent the exceptional profitability and scale has already been priced in.</p>]]></content><author><name></name></author><summary type="html"><![CDATA[On December 5, 1996, Federal Reserve Chair Alan Greenspan asked a now-famous question: “But how do we know when irrational exuberance has unduly escalated asset values?”]]></summary></entry></feed>