Revisiting Wheat and Sugar
In May, I argued that the oil shock might be expressed downstream through wheat, sugar and UK rates. By June 29, oil had failed to sustain its breakout and I closed the Hormuz setup. Wheat and sugar later rallied for reasons that partly matched the original thesis. This update separates what the framework captured from what the trade missed.
State of the Wheat Market
Escalating attacks on Black Sea ports, vessels, and grain infrastructure have been a primary catalyst in the wheat rally. Ukraine and Russia account for nearly 27% of global wheat exports. S&P Global estimates that attacks removed one third of Ukraine’s grain export capacity, while Russian export routes have also been affected. Ukraine, for example, reported that grain exports during the first 26 days of August reached only about 21% of their potential volume.
On August 19, SovEcon cut its forecast for Russian wheat exports that month to 2.2 million tonnes, compared with 4.5 million a year earlier and a five-year average of 5 million. Sizov argued that missed shipments could be difficult to recover because August through December is normally Russia’s peak export period, while winter storms and seasonal freezing constrain later flows. SovEcon said the reduced pace could lead to further cuts to its 2026/27 export forecast.
Import concentration has been a problem. Egypt sourced more than 82% of its wheat imports from Russia and Ukraine during the first half of 2026. Global buyers have been preparing for tighter supplies as delayed and cancelled Black Sea cargoes increased food security risks.
J.P. Morgan has recently warned that fertilizer disruption and El Nino could pressure food security and crop outcomes into 2027. The NOAA’s Climate Prediction Center estimates over a 90% chance of a “very strong” El Nino. That’s now baked into wheat pricing.
What the Wheat Framework Captured
The framework identified wheat as an asset with several vulnerabilities:
- Geopolitical disruption to physical trade
- Weather and crop uncertainty
- Historically weak U.S. acreage
- Concentrated dependence among politically sensitive importers
- The possibility that governments would value supply security more than price
It also stated that wheat did not require a perpetual Hormuz blockage to remain interesting. That mattered because the eventual direct catalyst came from the Black Sea rather than the Strait of Hormuz. That said limited Hormuz traffic can still threaten wheat production/pricing with a lag via the fertilizer and diesel channel.
What it did not Capture
The framework did not forecast the specific disruption to Black Sea grain infrastructure. Current conditions are better described as a distribution and deliverability problem. What remains to be seen is an aggregate global wheat shortage. Large harvests and restored/alternative shipping routes can reverse the scarcity premium.
Wheat Math
I ran a regression to estimate how much of wheat’s rally was consistent with its historical comovement with a basket of other commodities. The residual may reflect wheat specific developments, but the model alone cannot identify its cause.
One can estimate wheat’s beta by regressing wheat returns on the returns from a commodity benchmark. For example, a beta of 1.3 means wheat historically moved about 1.3% for each 1% move in the benchmark. R2 tells you how much of wheat’s daily variation the benchmark explains. An important choice is the benchmark. Using an index containing wheat will contain mechanical correlation. An inverse-volatility weighted basket gives smaller weights to volatile commodities and larger weights to stable ones. That prevents a market like corn from dominating the commodity factor because its daily moves are large.
The model is a one factor regression: wheat’s daily log return is regressed on an inverse-volatility weighted basket of commodities excluding wheat.
r_wheat,t = α + β(F_t) + ε_t
The ex-wheat commodity factor is defined as:
F_t = 0.120425(r_corn,t)
    + 0.155333(r_soybeans,t)
    + 0.126972(r_sugar,t)
    + 0.094171(r_coffee,t)
    + 0.113821(r_cotton,t)
    + 0.084510(r_crude,t)
    + 0.120166(r_copper,t)
    + 0.184601(r_gold,t)
Using data from January 2021 through June 2026, the fitted regression is:
r_wheat,t = -0.000241 + 0.9595(F_t) + ε_t
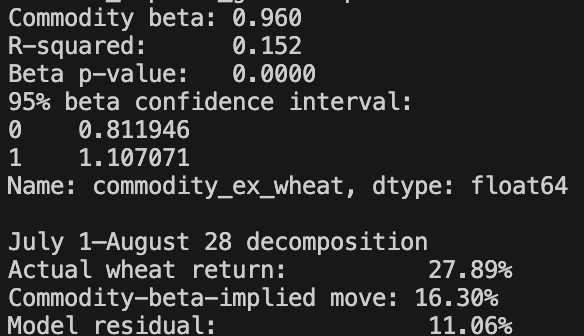
Here, F_t is the return on the constructed commodity factor, 0.9595 is wheat’s estimated beta to that factor, and ε_t is the portion of wheat’s daily return left unexplained by the model. The 95% confidence interval is 0.81 to 1.11. The z stat of the beta estimate being statistically different from zero is 12.8. The R2 is 0.15.
From July 1 through August 28, Yahoo Finance’s continuous front month wheat series (Soft Red Winter) rose 27.9%. Applying the pre-event relationship, the commodities basket implied a 16.3% move, while the model produced a compounded residual of approximately 11.1%. These figures do not add because returns are compounded and the beta implied calculation excludes the regression intercept. The evidence indicates that broad commodity exposure explains a modest share of wheat’s daily variation and leaves substantial scope for the wheat specific news.
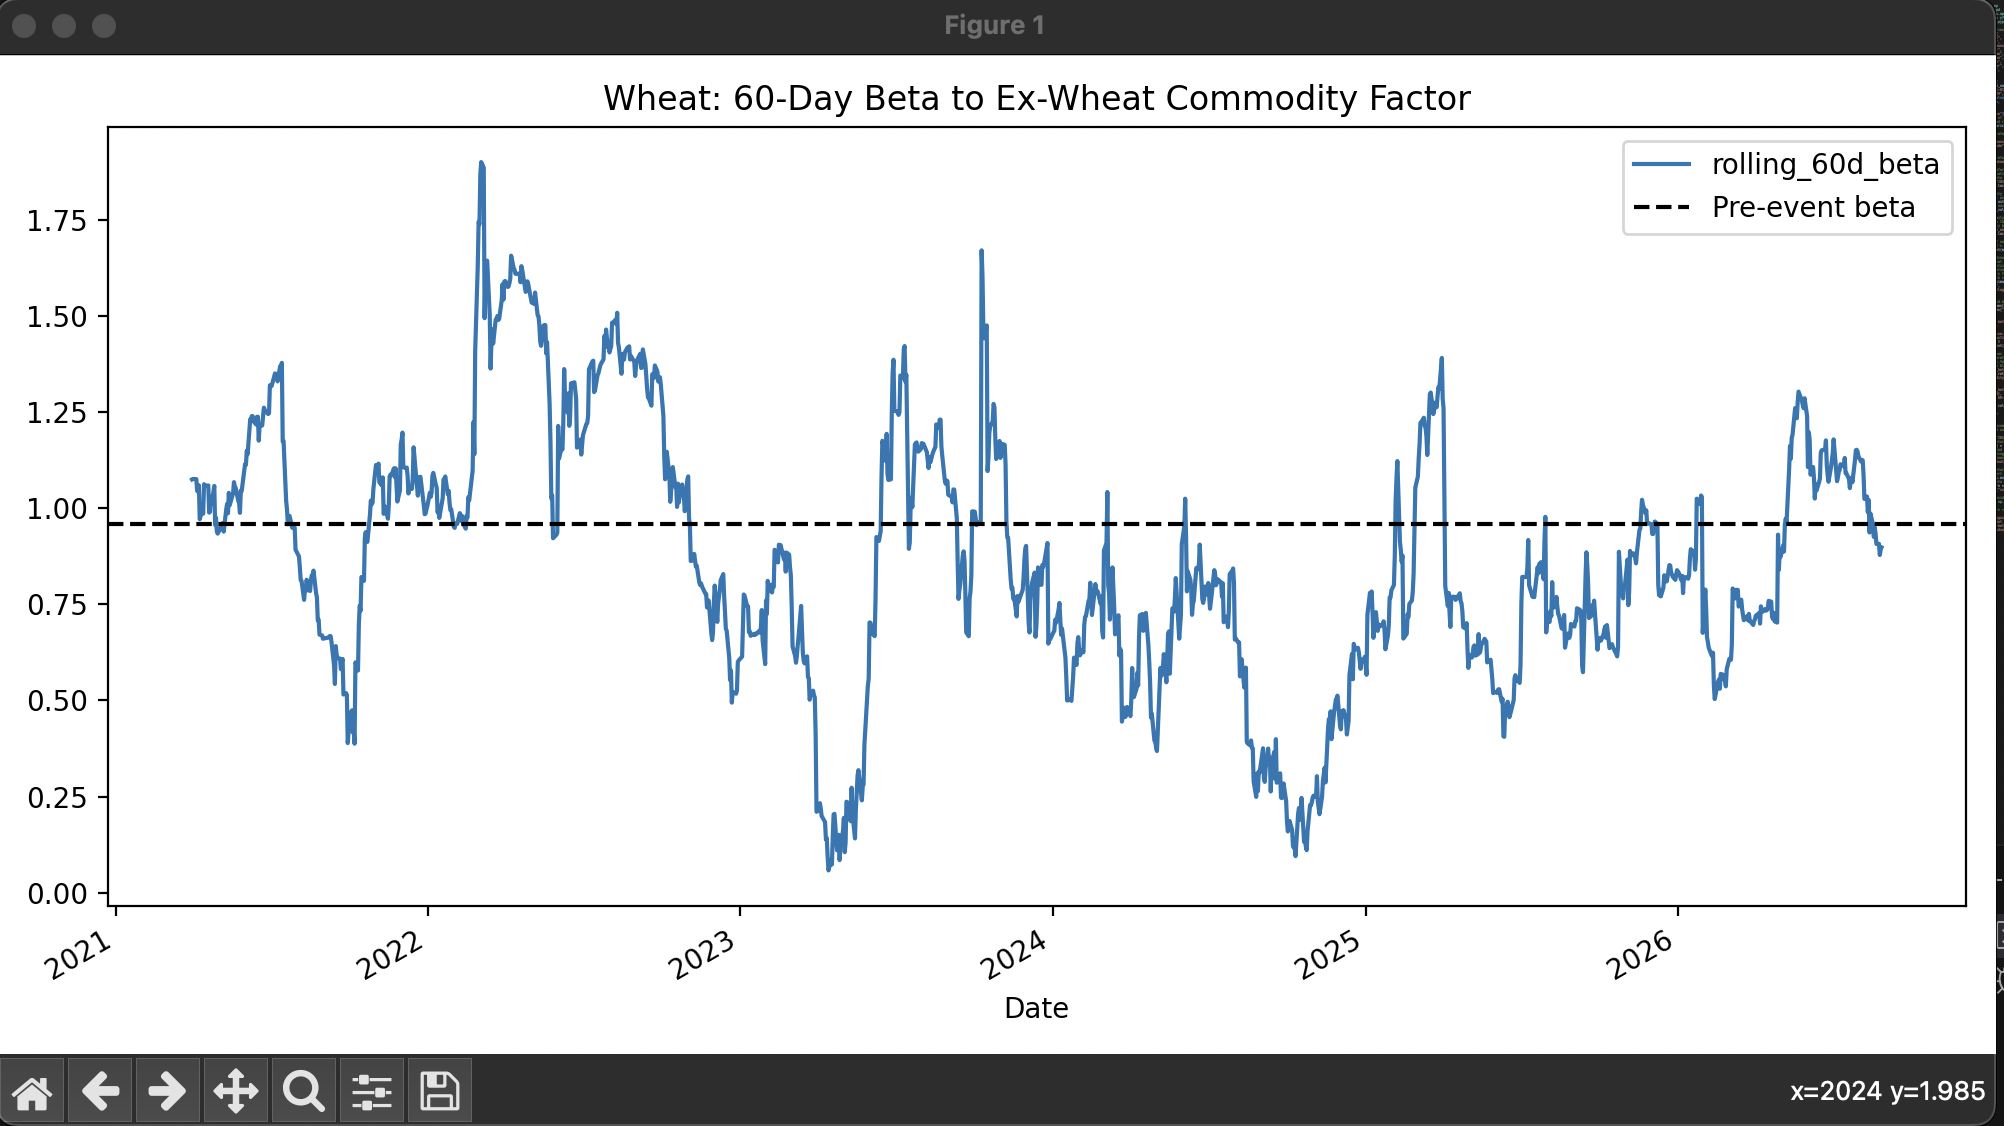 The Python code is available in the CommodityStats repository.
State of the Sugar Market
Sugar initially weakened after the post. The IMF’s Sugar No. 11 benchmark averaged 14.77 cents per pound in May and 13.91 cents in June. It subsequently recovered, and raw sugar futures traded above 18 cents in August, reaching their highest level in more than a year. The eventual rally reflected several forces. Forecasts for the 2026/27 global sugar balance shifted sharply tighter: StoneX increased its projected shortfall. Other forecasters reduced their projected surplus or moved into deficit. Production in Centre-South Brazil disappointed and El Nino raised weather risks. India authorized one million tons of duty-free raw sugar imports after domestic prices rose and production fell below earlier expectations.
What the Sugar Framework Captured
The research correctly focused on the flexibility between sugar and ethanol as an important variable. From April through June, Center-South mills allocated 57.48% of cane to ethanol, compared to 48.96% during the same period last season, while the sugar share fell from 51.04% to 42.52%. The framework also recognized that the relationship was reflexive rather than unlimited. If sugar rallied far enough relative to ethanol, mills could shift cane back toward sugar, adding supply and capping the move.
What it did not Capture
The sugar rally was not a clean realization of the oil shock thesis. The stronger August move was associated with a strengthening El Nino pattern, downward revisions to global sugar balance estimates, and the possibility that India would need to import sugar. Recovering ethanol values did contribute but only partially at best.
The May post explicitly said that wheat depended on “weather, crop expectations, and food-security behavior,” whereas sugar was described as “fairly direct” through ethanol allocation. It would be inaccurate to claim that the sugar framework anticipated weather as the principal catalyst. India and the global balance were discussed, but in the opposite direction from what later occurred: I identified potential Indian exports and a global surplus of five to eleven million tons as forces that could absorb the shock and prevent expensive calls from paying.
Scorecard
- The SONIA hedge worked during the original trading window.
- The Hormuz specific setup was closed when its catalyst temporarily weakened.
- Black Sea disruptions created heightened wheat deliverability risk, consistent with the broader framework’s focus on disrupted trade and food-security behavior.
- Sugar’s ethanol allocation mechanism remained relevant, but the rally was driven primarily by weather and disappointing production that the original framework did not anticipate.
- I did not capture the wheat and sugar rallies as P&L. Research != P&L.
What Matters From Here
USDA forecasts U.S. wheat production at 1.531 billion bushels, the lowest since 1970/71. FAO expects global wheat output to decline from last year’s record. These figures reduce the shock absorbing margin for further weather or supply chain disruptions, although FAO still described global stocks as comfortable.
An immediate risk is the Black Sea (+ Russian refining capacity). If disruptions persist while inventories decline, importers could move from delaying purchases to securing physical supply regardless of price – the transition from normal crop pricing toward the food security pricing regime described in the original framework.
Chicago wheat has already risen more than 27.9% from the beginning of July to the end of August (from the Yahoo Finance front month returns). Importers can draw inventories or find alternative suppliers, and improved Black Sea access or favorable Southern Hemisphere weather could recover part of the premium.